This reference lists the workloads that run in an on-premises Cisco Crosswork Assurance deployment on Kubernetes. For each workload, it states what the workload does, what you notice when it is unhealthy, and where to look first. The groups match the rows of the PCA Service Health (Kubernetes) Grafana dashboard, so you can move from a red row on the dashboard to the matching table here.
Workload names, Grafana dashboards, and some consoles still use the earlier product name, Provider Connectivity Assurance (PCA). The default platform namespace is pca. If you installed into a different namespace, substitute it in every command on this page.
Before You Begin
- You need
kubectlaccess to the cluster with read permission in the platform namespace. - You need a Crosswork Assurance user with the deployment administrator role to open Platform Administration and Grafana.
- In this page,
<pca-host>is the hostname of your deployment and<pod>is a pod name fromkubectl get pods.
How Data Flows Through the Platform
Most "no data" and "slow" problems are easiest to locate if you follow the data path. Collectors at your edge send measurements in, and the platform normalizes, stores, and indexes them before the portal queries them. Each measured entity, such as an interface or a test session, is a monitored object.
The platform stores data in the Hadoop Distributed File System (HDFS) and indexes it in Apache Druid, an analytics database.
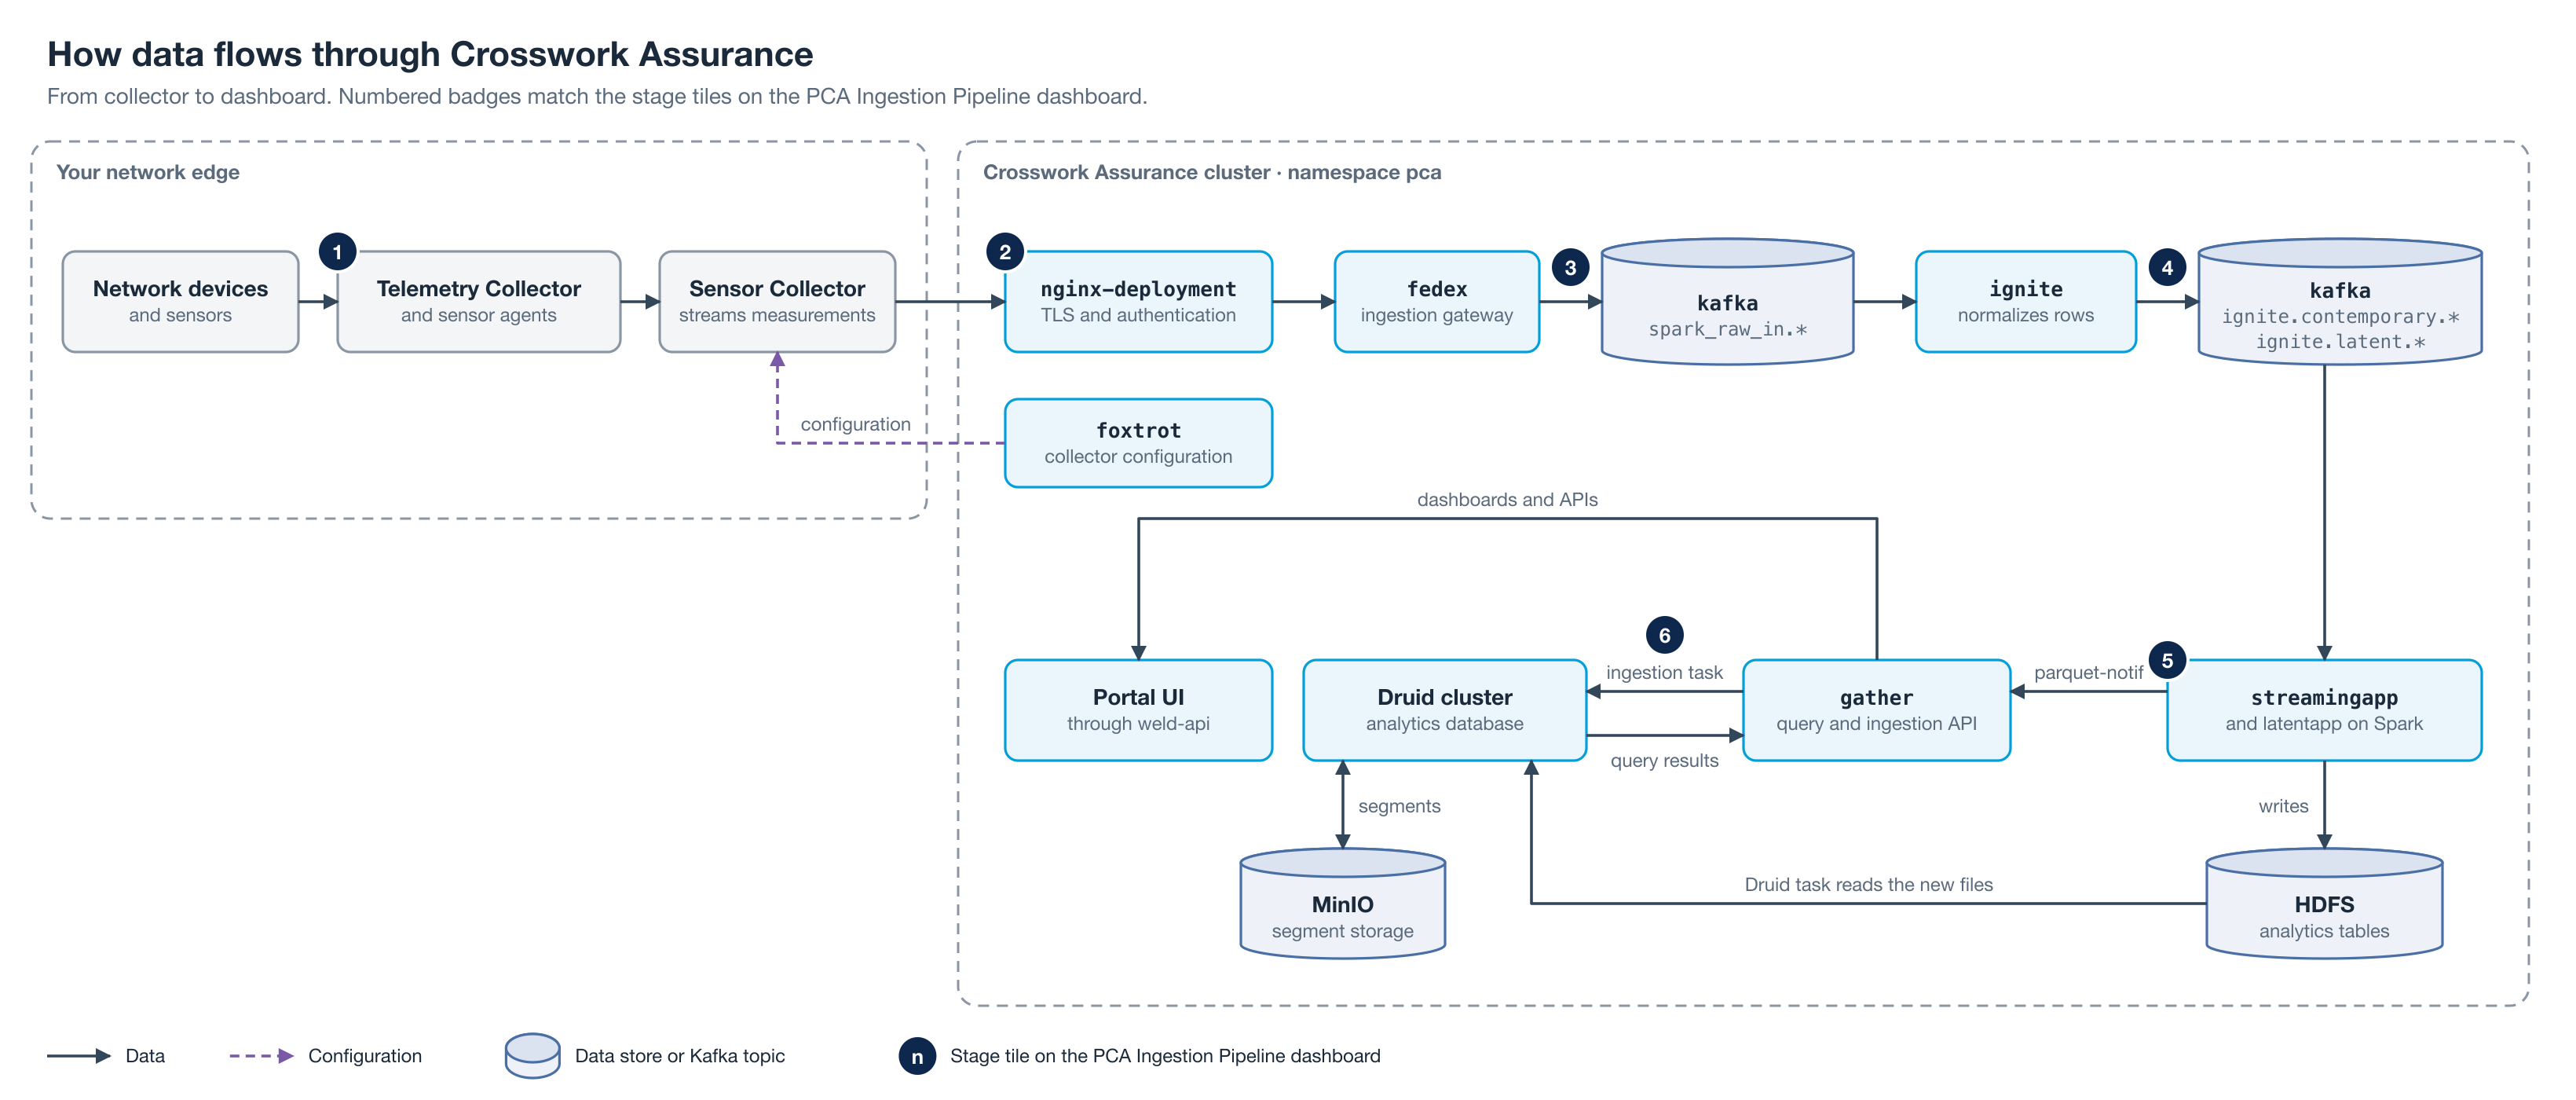
Measurements leave your network through the Sensor Collector and enter the cluster through nginx-deployment. Inside the cluster, they pass through fedex, a raw Kafka topic, ignite, and a normalized Kafka topic to the Spark streaming applications, which write them to HDFS. gather then has Druid load the new files, and the Portal UI queries Druid through gather. foxtrot sends configuration to the Sensor Collector separately from the data path.
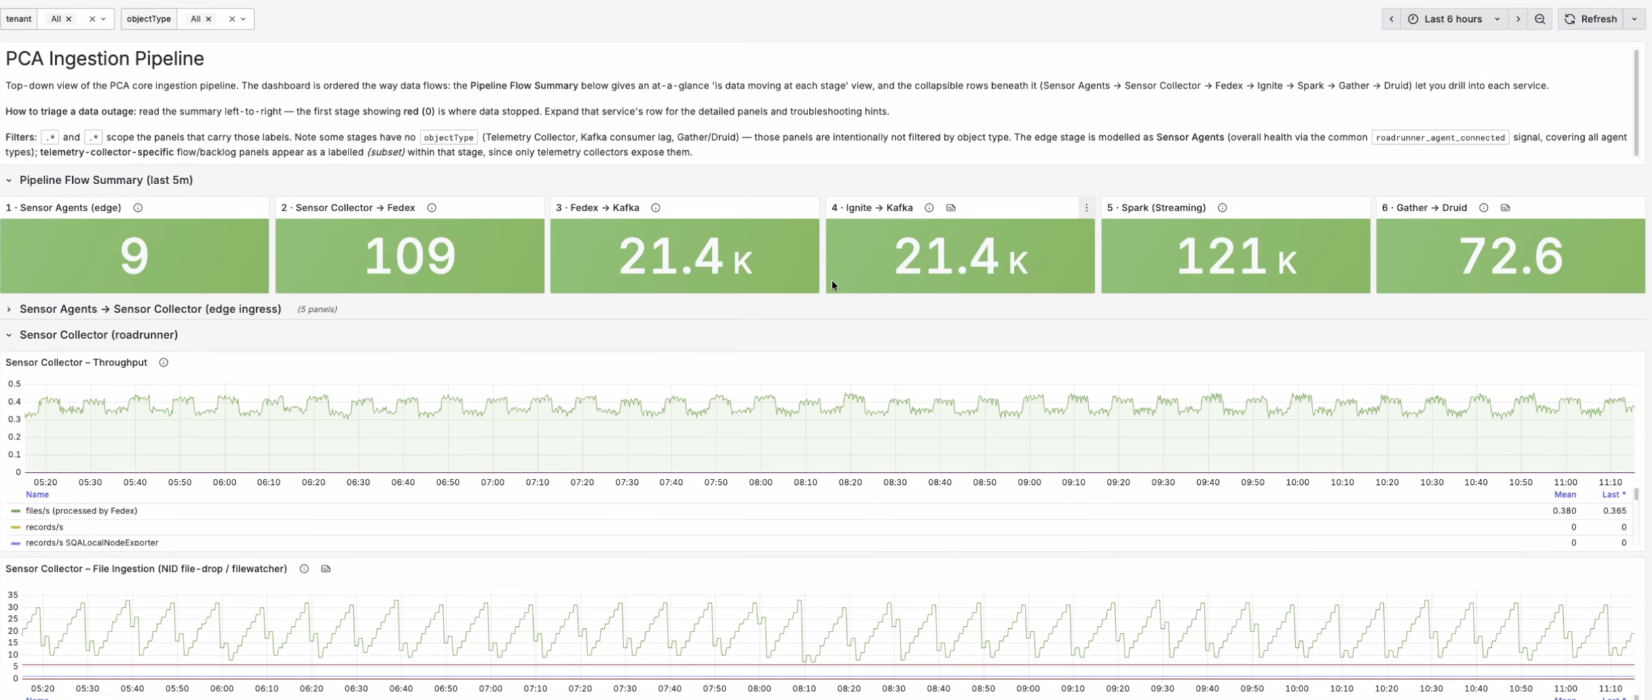
The PCA Ingestion Pipeline dashboard shows one tile for each stage in the following table. The numbers match the badges in the diagram. The first stage that shows red (0) is where data stopped.
| Stage tile | Workloads | Healthy when |
|---|---|---|
| 1 · Sensor Agents (edge) | Telemetry Collector, sensor agents | Agents report connected and send data |
| 2 · Sensor Collector → Fedex | Sensor Collector, nginx-deployment, fedex |
Fedex receives records from each collector |
| 3 · Fedex → Kafka | fedex, kafka |
Fedex writes Sensor Collector records to spark_raw_in or latent_raw_in without dropping any |
| 4 · Ignite → Kafka | ignite |
Ignite writes normalized rows and its ingestion lag stays flat |
| 5 · Spark (Streaming) | streamingapp, latentapp, alertstream |
Consumer lag stays flat instead of growing |
| 6 · Gather → Druid | gather, Druid cluster |
Gather submits Druid ingestion tasks without failures |
How Druid Receives Metric Data
Druid loads performance metrics in batches. After Spark stores new data in HDFS, gather submits a batch ingestion task, and Druid loads the new files. Rollups at 1-minute, 15-minute, and 1-hour intervals follow the same path after scheduled Airflow jobs build them.
To check that Druid is loading data, open the Druid console. The Tasks tab shows the result of each ingestion task, and the Datasources tab shows how much of each datasource is available. The Supervisors tab lists streaming ingestion, which only routing analytics and OpenTelemetry (OTel) event data use.
What Contemporary and Latent Mean on Kafka Dashboards
Kafka dashboards show topic names followed by the tenant ID and the object type. Contemporary and latent data each use a pair of topics: a raw topic that fedex writes and ignite reads, and a normalized topic that ignite writes and Spark reads.
| Data | Raw topic | Normalized topic |
|---|---|---|
| Contemporary: less than 2 hours old | spark_raw_in |
ignite.contemporary |
| Latent: more than 2 hours old | latent_raw_in |
ignite.latent |
How to read these rates:
ignite.contemporarytraffic is continuous and follows collector traffic. Its message rate is higher than the raw topics because one raw message holds a batch of many rows.ignite.latenttraffic is normally low. Sustained latent traffic means data is arriving more than 2 hours late, for example after a collector outage or whilestreamingappis catching up.- Consumer lag is a better health signal than message rate. Lag that grows for the
ignite,streamingapp, orlatentappconsumer group means that stage cannot keep up.
If a stage stays stopped for too long, Kafka deletes the data that stage has not read, and the data cannot be recovered. Kafka keeps contemporary raw data for 24 hours, latent raw data for 96 hours, and normalized data for 4 days, so restore a stopped ignite within 24 hours and a stopped streamingapp within 4 days.
Where to Check Health
More info may be available here: Platform Administration Interface
| Tool | How to open it | Use it to |
|---|---|---|
| Platform Administration → Platform health | https://<pca-host>/deployment/ |
See the status of each pipeline stage in one view |
| Platform Administration → Resources | https://<pca-host>/deployment/ |
Open the consoles in the next table |
| Grafana Customer (k8s) folder | https://<pca-host>/grafana/ |
Find where a problem is and when it started |
kubectl |
Your cluster workstation | See pod status, events, and logs |
| Admin Console (KOTS) | The address set at installation | Change configuration, upgrade, and create a support bundle |
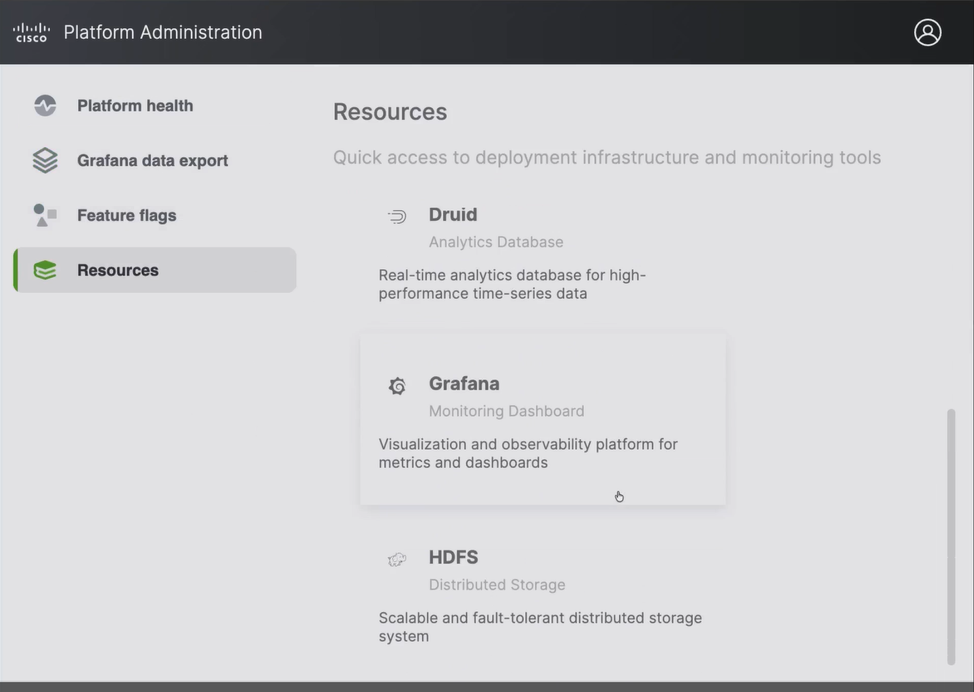
The Resources page in Platform Administration links to these consoles:
| Tile | Path | Use it to |
|---|---|---|
| Analytics Database (Druid) | /router/unified-console.html |
Check ingestion tasks, datasource availability, and segments |
| Monitoring Dashboard (Grafana) | /grafana/ |
Open the operational dashboards |
| Distributed Storage (HDFS) | /namenode/index.html |
Check DataNode status and storage capacity |
| Workflow Orchestration (Airflow) | /airflowui/ |
Check scheduled job runs and their task logs |
| Data Processing (Spark) | /sparkui/ |
Check that streaming applications are running |
| Document Database (CouchDB) | /couchdb/_utils/ |
Inspect configuration databases (read only) |
| Identity Management (Zitadel) | /ui/console/ |
Manage identity provider users and settings |
Grafana Dashboards for Operations
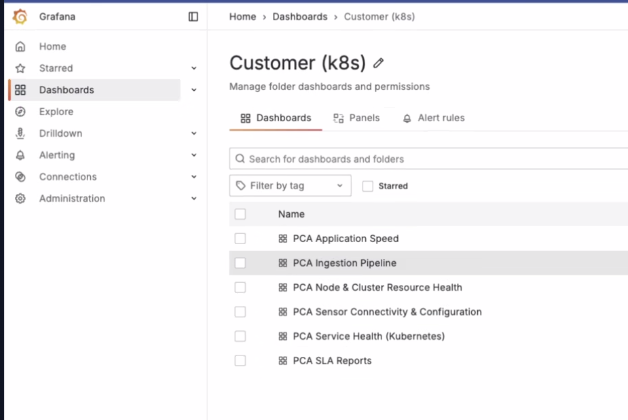
The Customer (k8s) folder in Grafana contains five dashboards for day-to-day operation. Each dashboard opens with a summary row that uses green, amber, and red, followed by detail rows you expand when a summary tile changes color.
| Dashboard | Question it answers | Start with |
|---|---|---|
| PCA Service Health (Kubernetes) | Which services are down or degraded, and since when? | Cluster Service Summary (now) row |
| PCA Ingestion Pipeline | Where did data stop on its way to Druid? | Pipeline Flow Summary (last 5m) row |
| PCA Sensor Connectivity & Configuration | Which collectors and sensors are disconnected, and why? | Connectivity Summary (now) row |
| PCA Node & Cluster Resource Health | Is a node or pod short of CPU, memory, disk, or I/O? | Cluster Overview (now) row |
| PCA Application Speed | Which API, database, or Spark job is slow? | API Overview (RED) row |
If your release does not include the Customer (k8s) folder, contact Cisco to get the dashboards as JSON files to import. On Kubernetes, the older Druid dashboard shows No data in its Coordinator and Java virtual machine (JVM) panels. Use the Druid row of PCA Ingestion Pipeline and the Druid console instead.
Example:
Where to Find Logs
Crosswork Assurance does not ship a central log store. Each container writes its log to standard output, and Kubernetes keeps it according to your cluster's log retention settings.
| To see | Run or open |
|---|---|
| Current log of a pod | kubectl logs -n pca <pod> --tail=500 |
| Log of the previous container, after a restart | kubectl logs -n pca <pod> --previous |
| Why a pod restarted or cannot start | kubectl describe pod -n pca <pod>, then read Last State and Events |
| Recent cluster events, newest last | kubectl get events -n pca --sort-by=.lastTimestamp |
| Airflow job logs | Airflow console, select the DAG (scheduled job), then the run and the task |
| Druid ingestion task logs | Druid console, Tasks tab, select the task |
| Logs from every pod, for Cisco support | Admin Console, Troubleshoot tab, generate a support bundle |
Sensor Collector Logs
The Sensor Collector runs at your edge, not in the platform namespace. It logs to standard output at INFO level by default.
- For a Docker installation, run
sudo docker psto find the Sensor Collector container, then runsudo docker logs <container>. - For a Kubernetes installation, run
kubectl get pods -A | grep sensor-collectorto find the pod and its namespace. The downloaded Helm package installs intocisco-sensor-collectorsby default. - A healthy startup logs
Successfully connected to DataHubandReceived config from DH. - If the log shows
Requesting configbut neverReceived config, the collector is connected but is not getting its configuration.
Telemetry Collector Logs
The Telemetry Collector also runs at your edge and logs to standard output. Run sudo docker logs <container> on its host. A healthy collector logs Connection to management established.
Sign-In Credentials
Three different sign-ins administer a deployment. A lost password for one does not affect the others.
| Sign-in | Used for | Initial password | If you lose it |
|---|---|---|---|
| Admin Console (KOTS) | Installation, configuration, upgrades, support bundles | Set when you install | Reset it from the cluster command line (see the troubleshooting section) |
| Crosswork Assurance root administrator | Portal, Platform Administration, Grafana | Set in the Admin Console configuration at installation; you must change it at first sign-in | Contact Cisco support |
| Sensor Management | The Sensor Management web interface, if installed | Set at installation | Contact Cisco support |
Service Reference
Each table lists the workload name as kubectl get pods shows it. StatefulSet pods end in -0, -1, and so on. Deployment pods end in a generated suffix.
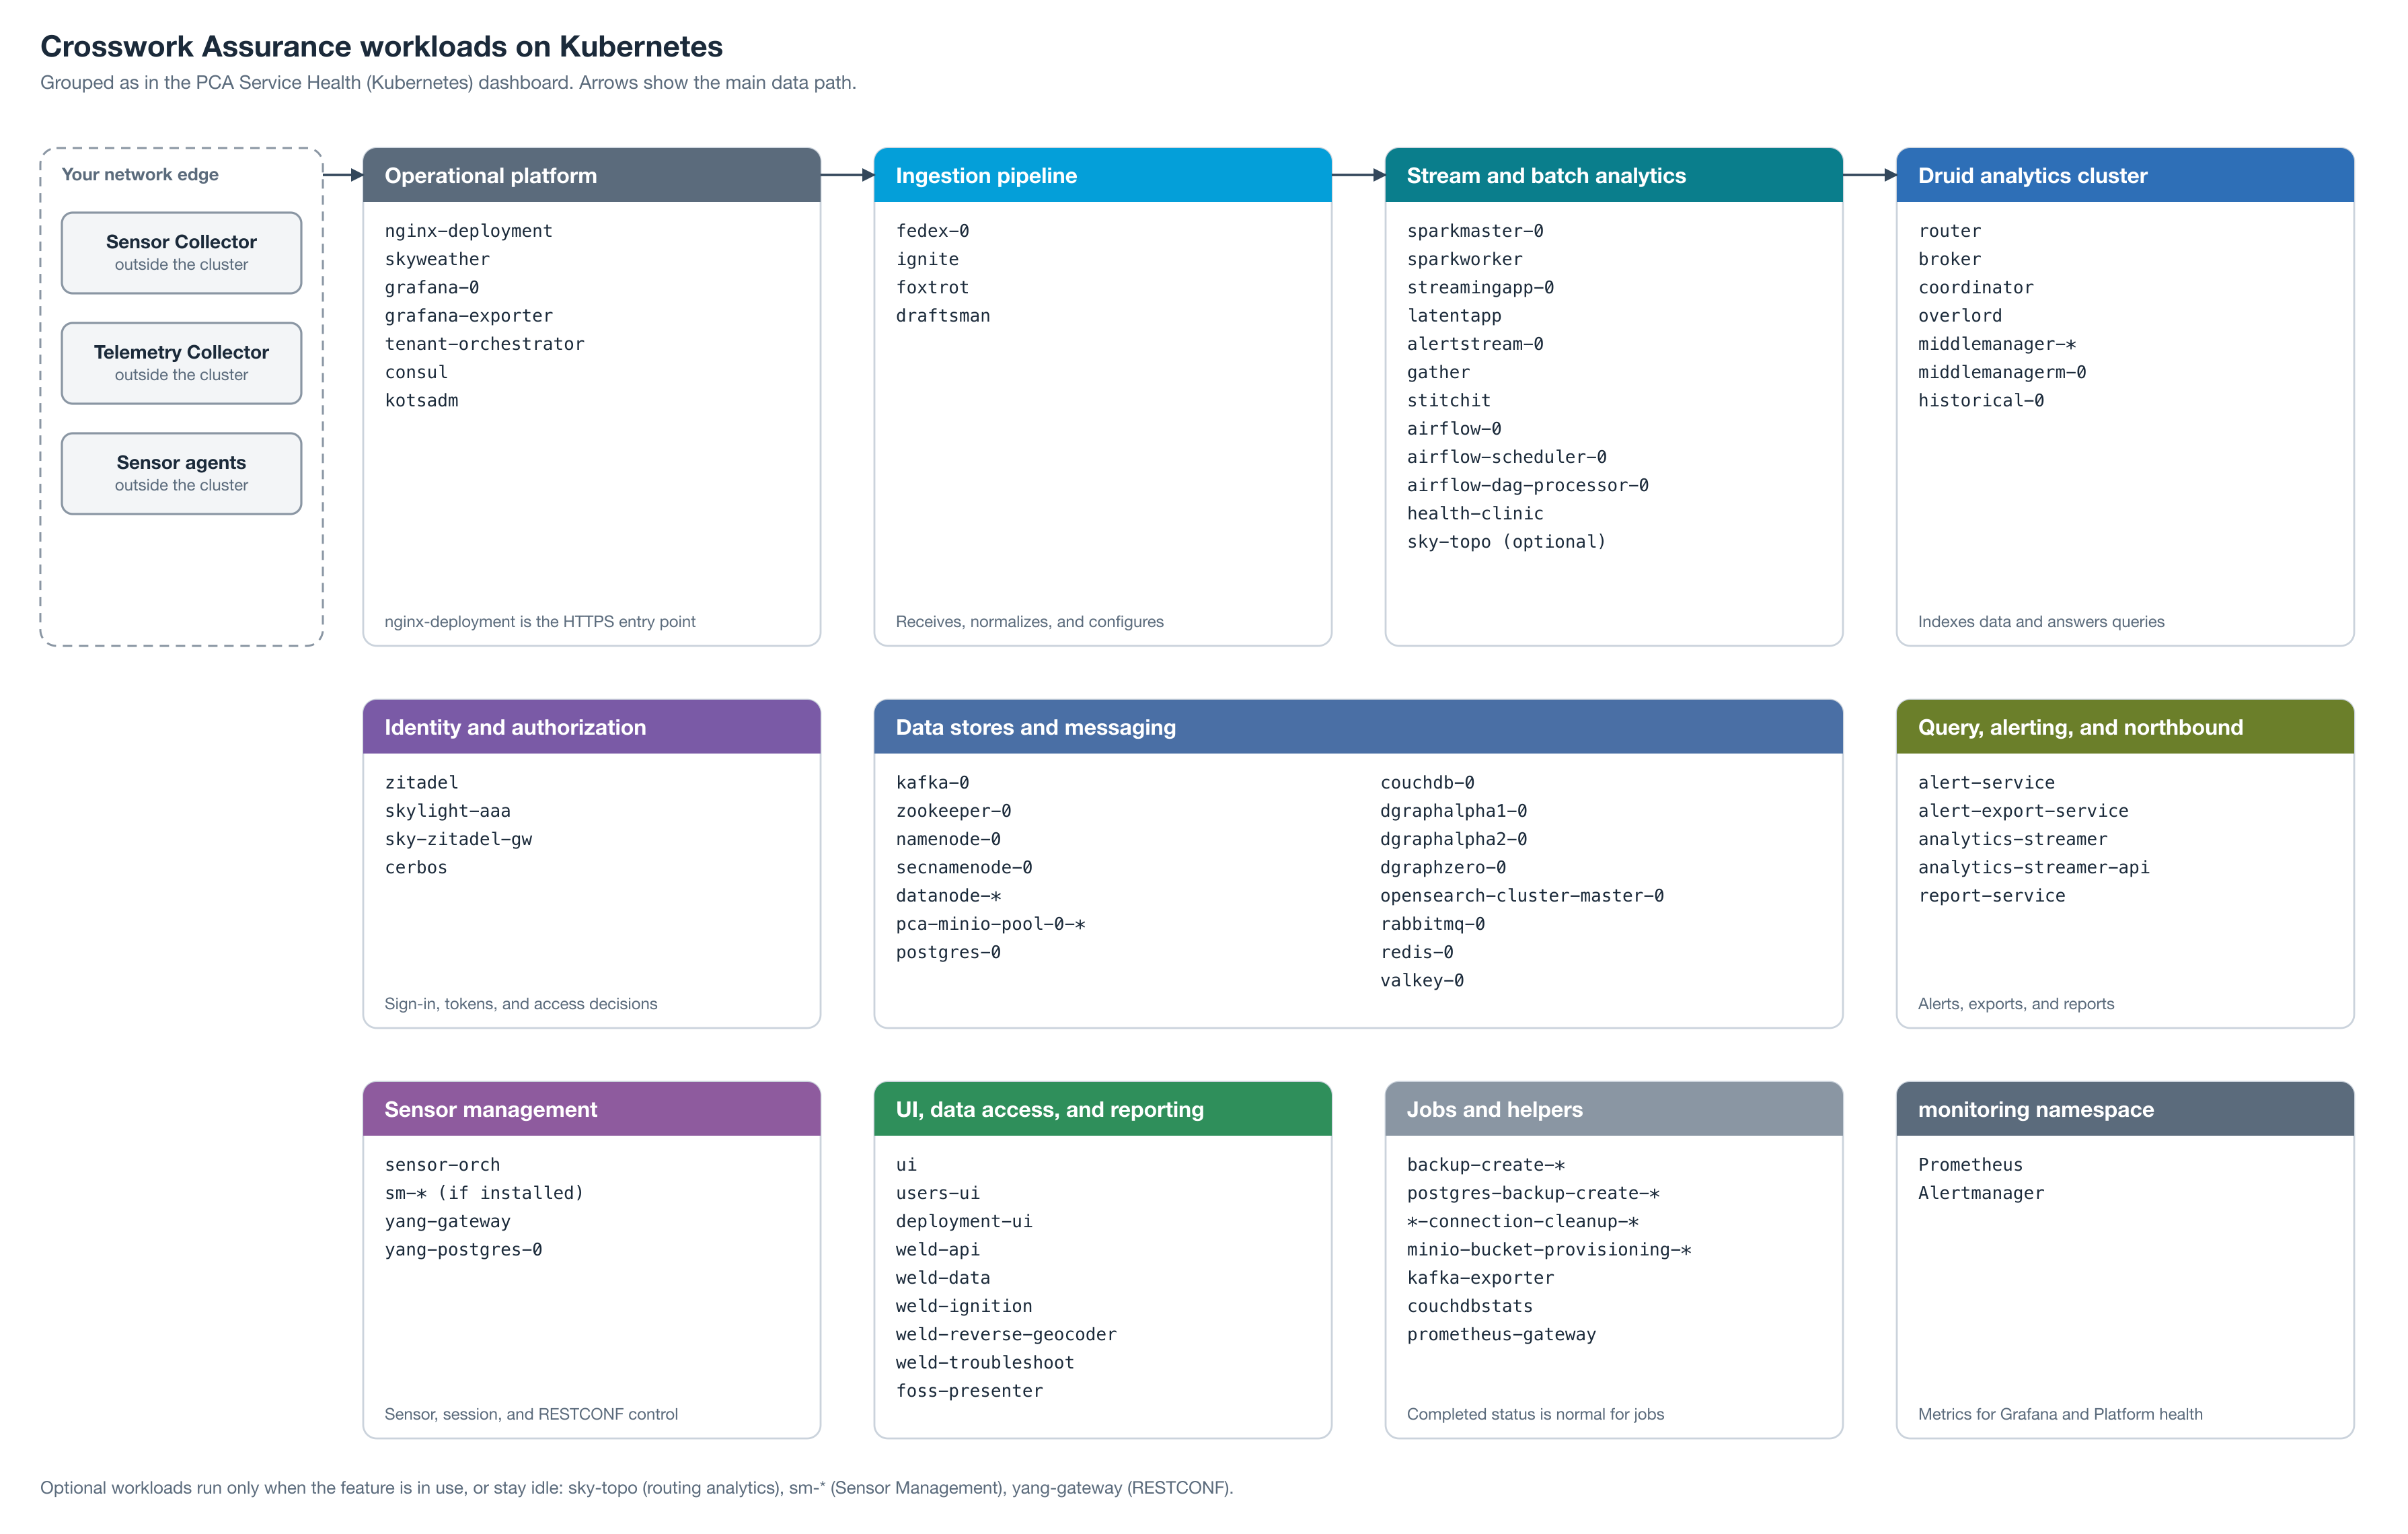
The map shows every group in this section. The arrows across the top row follow the main data path from your edge through nginx-deployment, the ingestion pipeline, and analytics into Druid.
Ingestion Pipeline
| Workload | What it does | If it is unhealthy |
|---|---|---|
| Sensor Collector (your edge) | Collects measurements from agents, files, SNMP, and OpenMetrics and streams them in | No new data from its zone; it buffers to disk until it reconnects |
| Telemetry Collector (your edge) | Receives model-driven telemetry and gRPC Network Management Interface (gNMI) data from IOS XR and IOS XE | Telemetry from its devices stops; it shows Offline under Sensors |
fedex-0 |
Receives collector data over WebSocket and writes it to raw Kafka topics | All collector intake stops; collectors buffer and retry |
ignite-* |
Normalizes raw data, discovers new monitored objects, and routes rows by age for Spark | No new data reaches dashboards or alerts; new objects are not discovered |
foxtrot-* |
Sends configuration to Sensor Collectors and reports their connection status | Configuration changes stop; data still flows through fedex |
draftsman-* |
Manages ingestion specifications and Telemetry Collector configuration | You cannot change ingestion settings; existing settings keep working |
Stream and Batch Analytics
| Workload | What it does | If it is unhealthy |
|---|---|---|
sparkmaster-0, sparkworker-* |
Spark cluster that runs the streaming applications and scheduled batch jobs | Streaming applications and rollups stop |
streamingapp-0 |
Stores current data in HDFS and evaluates threshold alert policies | No new data in dashboards; alerts are not raised or cleared |
latentapp-* |
Stages data that arrived late for the late-data repair job | Late data is not backfilled |
alertstream-0 |
Stores alert history | Alert history stops updating; active alerts still work |
gather-* |
Main query and provisioning API; submits Druid ingestion tasks | Portal pages fail; new data is not loaded into Druid |
stitchit-* |
Stores the network asset inventory (circuits and nodes) | Network asset views fail; circuit metrics are skipped |
airflow-0, airflow-scheduler-0, airflow-dag-processor-0 |
Schedules rollups, compaction, baselines, late-data repair, cleanup, and exports | Long time ranges show gaps; HDFS cleanup stops and disk use grows |
health-clinic-* |
Checks Druid, Airflow, agent, and backup status and publishes the results as metrics | Monitoring visibility only; no effect on data |
sky-topo-*, sky-topo-processor-* |
Routing analytics topology | Routing analytics views only; idle if you do not use routing analytics |
Druid Analytics Cluster
| Workload | What it does | If it is unhealthy |
|---|---|---|
router-* |
Single entry point for Druid queries and the Druid console | Dashboards fail; the Druid console does not open |
broker-* |
Sends each query to the historicals that hold the data and merges results | Dashboards fail or time out |
coordinator-* |
Assigns data segments to historicals and applies retention | New data stops becoming queryable; other Druid roles wait for it at startup |
overlord-* |
Accepts ingestion tasks and assigns them to MiddleManagers | New data is not loaded |
middlemanager-*, middlemanagerm-0 |
Run ingestion tasks | Ingestion slows or stops when no task slots are free |
historical-0 |
Holds data segments and answers queries | Queries return partial data or fail |
Data Stores and Messaging
| Workload | What it does | If it is unhealthy |
|---|---|---|
kafka-0 |
Message backbone between pipeline stages | The pipeline stops; Druid roles cannot start |
zookeeper-0 |
Coordination for Kafka, Druid, and Ignite | Kafka, Druid, and Ignite stop working |
namenode-0, secnamenode-0, datanode-* |
HDFS storage for Spark analytics tables | Ingestion, rollups, and alert history stop |
pca-minio-pool-0-* |
Object storage for Druid segments and database backups | Druid cannot load data; backups fail |
postgres-0 |
Database for identity, authorization, Airflow, and Druid metadata | Sign-in, Airflow, and Druid fail |
couchdb-0 |
Database for dashboards, settings, collector configuration, and report schedules | The portal and collector configuration fail |
dgraphalpha1-0, dgraphalpha2-0, dgraphzero-0 |
Graph database for the network asset inventory | Inventory queries and updates fail |
opensearch-cluster-master-0 |
Stores active alerts (not logs) | The active alerts view fails |
rabbitmq-0 |
Message Queuing Telemetry Transport (MQTT) broker for alert and sensor notifications | Alert notifications and alert exports stop |
redis-0 |
Cache for sensor session status | Sensor session status goes stale |
valkey-0 |
Store for discovered telemetry objects and collector status reports | Discovered-object views fail |
Query, Alerting, and Northbound
| Workload | What it does | If it is unhealthy |
|---|---|---|
alert-service-* |
Maintains active alerts and publishes alert notifications | Active alerts and notifications stop |
alert-export-service-* |
Forwards alerts to webhooks and Splunk HTTP Event Collector | Alert exports stop |
analytics-streamer-*, analytics-streamer-api-* |
Streams metrics and alerts to your systems over gNMI or Kafka | Northbound streams stop |
report-service-* |
Renders and emails dashboard reports | Scheduled and on-demand reports fail |
Identity and Authorization
| Workload | What it does | If it is unhealthy |
|---|---|---|
zitadel-* |
Identity provider: sign-in page, users, service accounts, and tokens | Nobody can sign in |
skylight-aaa-* |
Validates every authenticated request and manages users, groups, and roles | All portal and API calls fail, not only sign-in |
sky-zitadel-gw-* |
Issues and renews tokens for devices and agents | New collectors and agents cannot onboard or renew tokens |
cerbos-* |
Decides which data and operations each role may access | Requests that need authorization fail |
Sensor Management and Control Plane
| Workload | What it does | If it is unhealthy |
|---|---|---|
sensor-orch-* |
Holds sensor agent, session, and schedule configuration and sends it to agents | Agent and session changes stop; agent status goes stale |
sm-* |
Sensor Management for Assurance Sensors and Sensor Control, if installed | Sensor Management web interface and API fail |
yang-gateway-*, yang-postgres-0 |
RESTCONF interface for external orchestrators such as Cisco Network Services Orchestrator (NSO) | External provisioning through RESTCONF fails |
UI, Data Access, and Reporting
| Workload | What it does | If it is unhealthy |
|---|---|---|
ui-* |
Portal web application | The portal does not load |
users-ui-* |
User, group, and account administration pages | User administration pages fail |
deployment-ui-* |
Platform Administration pages | Platform Administration does not load |
weld-api-* |
API layer between the web pages and platform services | Most portal and Platform Administration pages fail |
weld-data-* |
Platform settings, feature flags, notifications, and collector inventory | Settings and notification pages fail |
weld-ignition-*, weld-reverse-geocoder-*, weld-troubleshoot-* |
Branding, map place names, and ingestion diagnostics | Only the related page or map feature fails |
foss-presenter-* |
Open-source license notices | The license page does not load |
Operational Platform
| Workload | What it does | If it is unhealthy |
|---|---|---|
nginx-deployment-* |
HTTPS entry point; checks authentication and routes requests | All access fails, including collectors |
skyweather-* |
Calculates the Platform health status from Prometheus metrics | Platform health fails; support bundles have no health snapshot |
grafana-0 |
Operational dashboards | Dashboards are unavailable; data is not affected |
grafana-exporter-* |
Grafana data export in Platform Administration | Dashboard data export fails |
tenant-orchestrator-* |
Creates tenants and in-cluster Sensor Collectors | Tenant and collector creation fails |
consul-* |
Companion service deployed with rabbitmq-0 |
See rabbitmq-0 |
kotsadm-* |
Admin Console (KOTS): installation, configuration, upgrades, and support bundles | Configuration changes, upgrades, and support bundles are unavailable |
Prometheus runs in the monitoring namespace and stores the metrics that Grafana and Platform health display.
Jobs and Helpers
These pods are not product services. A Completed status is normal for jobs.
| Workload | Purpose |
|---|---|
backup-create-couchdb-*, backup-create-opensearch-*, postgres-backup-create-*, yang-postgres-backup-create-* |
Daily database backups to MinIO |
postgres-connection-cleanup-*, yang-postgres-connection-cleanup-* |
Close idle database connections every 15 minutes |
minio-bucket-provisioning-* |
Create storage buckets and backup retention rules at install and upgrade |
opensearch-active-alerts-template-*, opensearch-active-alerts-retro-apply-* |
Apply settings to active alert indexes |
helm-manifest-job-*, pre-auth-ca-certs-*, secret-mount-restart-* |
Install and upgrade steps |
kafka-exporter-*, couchdbstats-*, opensearch-cluster-master-exporter-*, blackbox-exporter-* |
Publish metrics for Kafka lag, CouchDB, OpenSearch, and endpoint probes |
prometheus-gateway-* |
Receives metrics that Spark jobs push |
A numeric suffix such as -6 on a job name identifies the install or upgrade that created it. Only the most recent job matters.
Troubleshooting
What do I do when a command's output is not what the guide expects?
Find the first failing stage, then read that workload's events and logs.
- Open PCA Service Health (Kubernetes) and find the group that is not green.
- Run
kubectl describe pod -n pca <pod>and read Events for image pull, scheduling, and probe failures. - Run
kubectl logs -n pca <pod> --previousif the pod restarted, or without--previousif it is running. - Check the workload's dependencies in the Service Reference tables. For example, if
postgres-0is down, identity workloads also become unready. - If the cause is still unclear, generate a support bundle from the Admin Console and attach it to a Cisco support case.
Why can't users sign in?
Sign-in depends on nginx-deployment, zitadel, skylight-aaa, cerbos, and postgres-0.
- In PCA Service Health (Kubernetes), check the Identity & authorization and Data stores & messaging rows.
- In PCA Application Speed, expand API detail – Skylight-AAA and look for a rise in error responses.
- Read the logs of
zitadel,skylight-aaa, andnginx-deployment, in that order.
A newly created tenant can take up to 15 minutes before its users can sign in.
Why do dashboards show no new data?
Open PCA Ingestion Pipeline and find the first red tile in Pipeline Flow Summary (last 5m). Expand that stage's row and check the workloads in the matching stage table.
- In the Druid console, check Tasks for failed ingestion tasks and Datasources for availability below 100%.
- If only long time ranges are missing data, check for failed DAG runs in the Airflow console.
Why can't a Sensor Collector connect?
- Open PCA Sensor Connectivity & Configuration and check Cert-auth rejections (1h) and Sensor Collector Client Cert – Days to Expiry.
- Read the Sensor Collector log (see Sensor Collector Logs).
- Compare the log with the following table.
| Log message or symptom | Meaning |
|---|---|
x509: certificate signed by unknown authority |
The collector does not trust the platform certificate authority |
503 Service Unavailable with Retry-After |
The collector reconnected too quickly; it retries after about 1 minute |
Requesting config without Received config |
The data connection works but foxtrot is not sending configuration |
Why is everything slow?
- Open PCA Node & Cluster Resource Health and check I/O-wait, CPU throttling, and Pods OOMKilled (last termination reason).
- Open PCA Application Speed and find the service with the highest response time and the largest consumer lag.
- In PCA Ingestion Pipeline, expand the Druid row and check Druid – Middlemanager Slot Availability.
Why do pods keep restarting?
Open PCA Service Health (Kubernetes), expand Restarts & Crash-loops (pod detail), and then run kubectl describe pod on a restarting pod.
- Status
Evictedmeans the node ran low on disk or memory and Kubernetes removed the pod. Runkubectl describe node <node>; aDiskPressurecondition ofTrueconfirms low disk. In PCA Node & Cluster Resource Health, check Fullest filesystem and Node – filesystem usage % (by mount), then free space or add capacity on that node. - A pod that restarts repeatedly and logs
No space left on devicehas a full persistent volume. Check Top PVCs – used bytes in PCA Node & Cluster Resource Health. - Last State
OOMKilledmeans the container exceeded its memory limit. - Last State
Errormeans the process exited; readkubectl logs --previous. - Probe failures in Events often mean a dependency is not ready. Druid roles wait for
kafka-0, andzitadelwaits forpostgres-0.
Why does the Druid dashboard show No data?
The Druid dashboard was built for Docker Swarm deployments. On Kubernetes, its Coordinator and JVM panels do not receive metrics. Use the Druid row in PCA Ingestion Pipeline and the Datasources and Tasks tabs in the Druid console.
Why does Platform health show an unexpected server error?
The Platform health page depends on deployment-ui, weld-api, skyweather, and Prometheus in the monitoring namespace.
- Confirm that you signed in with a deployment administrator account.
- Check that the four workloads are running:
kubectl get pods -n pca | grep -E 'deployment-ui|weld-api|skyweather'andkubectl get pods -n monitoring. - Read the logs of
weld-apiandskyweather, then include them in a support bundle for Cisco support.
How do I reset the Admin Console password?
The Admin Console does not display its own password. Reset it from a host with cluster access, using the command for your installation type:
# Installation on an existing Kubernetes cluster
kubectl kots reset-password <admin-console-namespace>

# Installation with the provided installer (embedded cluster)
sudo ./provider-connectivity-assurance admin-console reset-password
The command prompts for a new password. Sign in to the Admin Console with the new password.
© 2026 Cisco and/or its affiliates. All rights reserved.
For more information about trademarks, please visit: Cisco trademarks
For more information about legal terms, please visit: Cisco legal terms